The Negative Impact of the Department of Energy (DOE) 15% Overhead Rule on SBIR/STTR firms

The Negative Impact of the Department of Energy (DOE) 15% Overhead Rule on SBIR/STTR firms

The implementation of the 15% rule applied to the Department of Energy’s Small Business Innovation Research (SBIR) and Small Business Technology Transfer (STTR) programs will inadvertenty cripple the innovation for which this program has been justly recognized. In May 2025, the Department of Energy’s Office of Acquisition Management issued three Policy Flashes (PF) which limit the indirect rates allowed for grants and cooperative agreements. Collectively, these documents affect (1) nonprofits – in particular Institutions of Higher Education (PF 2025-26), (2) for profits – including both large and small business (PF 2025-27) and (3) state and local government (PF 2025-25). The stated purpose of the Policy Flashes is to improve efficiency and curtail costs where appropriate. PF 2025-27 clarifies that “The Department seeks to better balance the financial needs of financial assistance award recipients with the Department’s obligation to responsibly manage federal funds.”

However, what is left out of this balance is the profound and negative impact that this ceiling will have on small, advanced technology firms participating in DOE’s Small Business Innovation Research (SBIR) and Small Business Technology Transfer (STTR) programs. It will stifle their ability to advance DOE SBIR/STTR funded technologies into cutting edge, commercial products

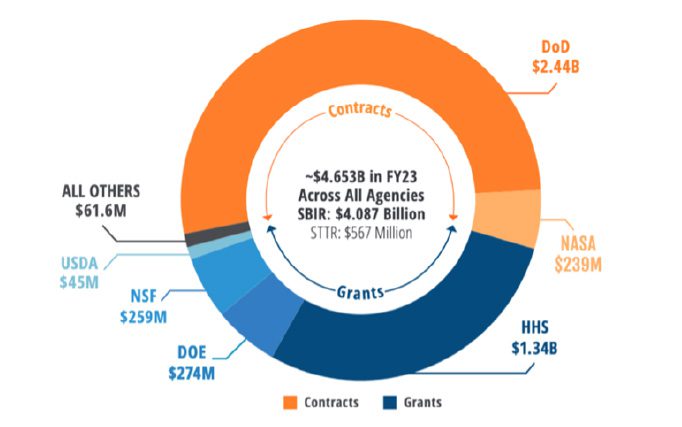
Funding for the SBIR/STTR programs comes out of extramural research and development funds. The federal government spent approximately $192 billion in FY23 on research and development.  According to the National Science Board two-thirds of the FY23 federal R&D budget ($128 billion) went to extramural performers, while the remainder ($64.1B) went to intramural performers.  Extramural performers include the three categories affected by the DOE Policy Flashes. In FY23, only $4.65B of the $128B spent on extramural R&D went to small business participating in the SBIR/STTR programs[1]. DOE which provides its SBIR/STTR awards as grants, accounted for just 5.89% of the total SBIR/STTR budget in FY23.

 Figure 1: FY2023 SBIR/STTR Budgets by Agency

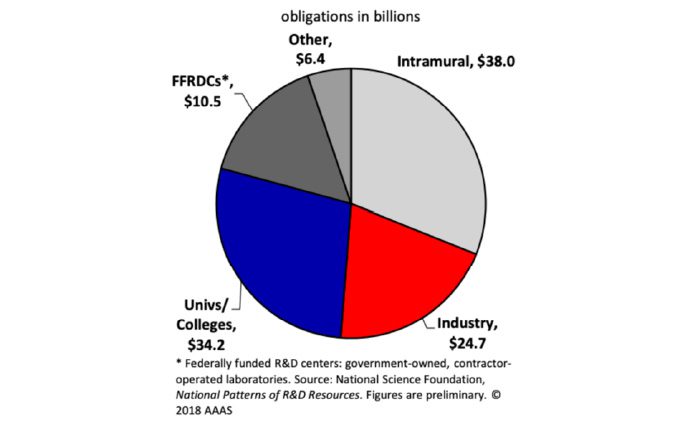
The amount of R&D funding that went to large business in FY23 is not readily available. However, one can gain insight into this information from a 2019 AAAS report. The following figure represents the distribution of federal R&D funding in FY16. The total amount of federal R&D funding spent on both intramural and extramural performers in FY16 was $113.8B. Of that total, $38B was spent on Intramural R&D, leaving $75.8B or 66% for extramural R&D. The combined SBIR/STTR budget in FY16 was $2.38B[2]. This represents 10.8% of the total extramural funding spent on industry ($24.7B) in FY16.

 Figure 2: Federal R&D by Performer, FY2016

Most extramural R&D funding is awarded to LARGE business, not to small SBIR/STTR funded firms. I can’t speak to the ability of large business to absorb a 15% indirect cost ceiling. However, the mission of small, advanced R&D firms focused on basic and applied research limits their ability to supplement a 15% indirect cost ceiling. A potential side effect of  PF 2025-27 is that DOE will lose some of its more seasoned performers to other Agencies participating in the SBIR/STTR program that use contracts as opposed to grants.

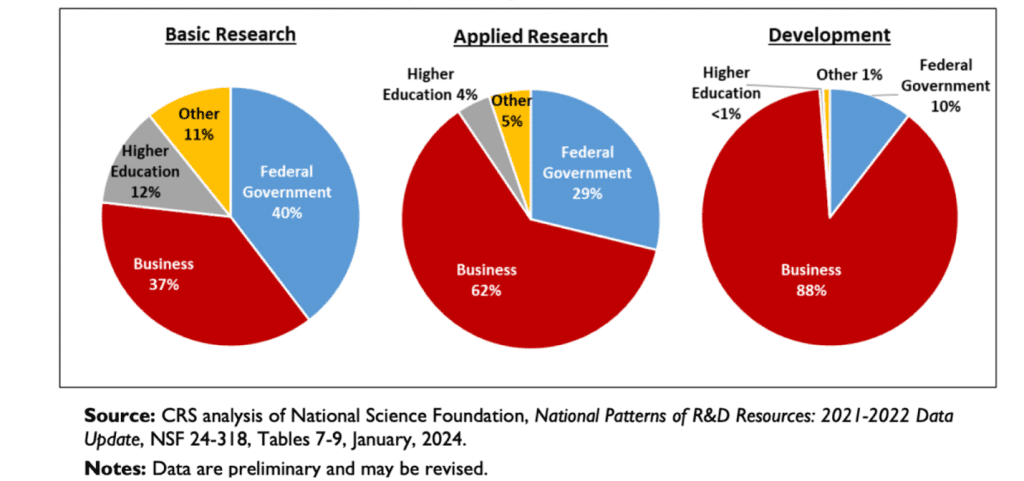
Although large business invests in R&D, studies conducted by the National Center for Science and Engineering Statistics indicate that the preferred model for large business  is to have high-risk, basic and applied research funded by the federal government and then become involved when the technology is de-risked at the development stage (TRL 6-9). When the technology is sufficiently mature, the smaller entities could be acquired by a larger firm, intellectual property licensed-in, or joint ventures formed.

 Figure 3: Composition of U.S. Basic Research, Applied Research and Development by Funding Sector, 2022.

PF 2025-27 states that “The Department plans to establish a maximum allowable dollar amount (stated in terms of a percentage of the total project award amount) that it will reimburse for allowable, allocable, and reasonable indirect costs under Awards. The percentage that will be reimbursable is inclusive of total indirect costs and fringe benefit costs.”

The 15% which is recommended in PF 2025-27 has historically been the de minimis and applies when the recipient does not have a current federal negotiated indirect cost rate. In practice, this tends to be used by start-ups which are often first-time applicants with minimal infrastructure. Start-ups with 1-3 employees use the de minimis rate as it does not require any back-up data. Fifteen percent of a Phase I DOE SBIR award of $200,000 is $30,000. Although this may sound like a lot to someone who has not run a business – health care benefits alone would take half of that in one gulp. If the company is a start-up working out of their home with minimal infrastructure, they might be able to make that work for their first year.

However, to grow a business so that it has the resources to both develop and commercialize a technology requires that a company add business functions and physical infrastructure. Gere Glover,  the Executive Director of the Small Business Technology Council  notes that the average indirect rate for maturing Department of Energy SBIR/STTR companies is approximately 50%. The 7% profit typically allowed to an SBIR/STTR firm by the Department of Energy cannot make up for the shortfall that the imposition of this 15% indirect rate will create. Implementation of this policy will damage their future and the ability of these companies to remain good suppliers of innovative technology to the Department of Energy.

PF 2025-27 states that “In circumstances where the Secretary has determined it is necessary and appropriate, the dollar threshold for payment of indirect costs may be modified for Award(s) to for-profit organizations that are subject to this policy.”

Grouping large and small businesses together that receive extramural R&D funds from the Department of Energy and then applying one indirect rate to all, ignores significant differences between large and small business. Large well-managed companies are financially stable and have an established and diverse infrastructure built over decades.  They have personnel dedicated to product development, marketing and sales, distribution, manufacturing, quality, legal and the like. Large businesses make profit from the products that they sell and have cash reserves.

For small, advanced technology firms to become and remain viable entities on the path to financial independence requires time and resources. Examples of the typical expenses an SBIR firm must cover are available in examples that DOE provides small business on how to develop indirect cost models.[1] In this document a sample ledger provided by DOE depicts a 32% fringe rate and a 12.2% Indirect rate for a total of 44.2%, when combined. Funding is the life blood of a company and a 15% indirect rate is inadequate for a small, advanced technology firm.

Given the importance of the innovation that stems from the SBIR/STTR program to the Trump Administration, it is respectfully suggested that indirect rates for companies participating in the SBIR and STTR program be considered for separate benchmarks established after an analysis of historical data on SBIR/STTR indirect rates.

[1] The FY2011 reauthorization of the SBIR program increased the set aside to 3.2% of the extramural R&D budget and 0.45% for the STTR program.


[2] Small Business Administration, “ SBIR/STTR 2016 Annual Report to Congress,” 2019


[3] DOE National Technology Laboratory, “Negotiated Indirect Cost Rate Agreement and Indirect Rate Proposal Guidance,” https://netl.doe.gov/sites/default/files/2024-09/Negotiated-Indirect-Cost-Rate-Agreement-and-Rate-Proposal-Guidance.pdf

Share this article:

Email
X
LinkedIn

Market Snapshot: Solid Oxide Fuel Cell Market

U.S. and global electricity demand are both expected to increase 50% or more by 2050. To meet anticipated demand, cleaner, more efficient, reliable, and affordable energy generation and storage solutions are needed. Solid oxide fuel cell (SOFC) technology is a promising, efficient, low-emissions means of generating electricity from a range of fuels, including hydrogen, natural gas, biogas, and syngas. A recent U.S. House of Representatives Energy & Water Development Appropriations subcommittee report (July 2025) recommended up to $30 million to advance SOFC research and development.

SOFCs, which produce electricity by oxidizing gaseous fuels at high temperatures, are closely tied to solid oxide electrolysis cells (SOECs) and reversible solid oxide fuel cell (R-SOFC) systems. While SOFCs use hydrogen and oxygen to produce electricity along with heat and water, SOECs use electricity, water, and heat to produce hydrogen gas, along with oxygen. R-SOFC systems are single, hybrid devices that can do both. SOFCs are the leading fuel cell technology for stationary applications and are well-suited to serving as continuous power supplies.

According to MarketsandMarkets, the global solid oxide fuel cell (SOFC) market is expected to grow at a compound annual growth rate (CAGR) of 31.2%, expanding from $2.98 billion in 2025 to $11.61 billion in 2030. These figures account for planar and tubular-type SOFCs and for the fuel cell stacks as well as the balance of the plant.* In these projections, analysts segment the market into portable, stationary, and transport applications and identify residential, commercial and industrial, data center, and military and defense customers as the major end user groups. MarketsandMarkets projects that data centers will be the fastest-growing end user group through 2030.

The fuel-to-electricity efficiency, near-zero emissions, and fuel flexibility of SOFCs, as well as the integration of R-SOFC systems with renewable energy sources, are driving market growth. As a result, substantial market opportunities are emerging. These include data centers, drones, battery chargers, distributed generation, microgrids, chemical and fuel production, transportation, and more. The high temperatures at which SOFCs operate make them an attractive option for industries using combined heat and power (CHP) systems to improve efficiency. However, SOFC technology is not without competition from other low-emissions fuel cell technologies, including molten carbonate (MCFC) and polymer electrolyte membrane (PEMFC) fuel cells. Currently, SOFC market growth is challenged by the high cost of high-durability materials needed for high-temperature operation.

Top players in the global SOFC market include Bloom Energy (U.S.), Mitsubishi Heavy Industries (Japan), AISIN Corp. (Japan), and Kyocera Corp. (Japan). The global SOFC market is fairly consolidated, as those four companies account for about 70-80% of the entire market, according to MarketsandMarkets. Other notable SOFC companies include Ceres Power (UK), Convion (Finland), Cummins (U.S.), Doosan Fuel Cell (S. Korea), Elcogen (Estonia), FuelCell Energy (U.S.), Miura (Japan), Nexceris (U.S.), Sunfire (Germany), WATT Fuel Cell (U.S.), and Bosch (Germany), which pivoted away from the SOFC business in early 2025 in favor of hydrogen-generating electrolyzers.

The DOE Office of Fossil Energy and Carbon Management (FECM) supports the growth of the domestic market with its Solid Oxide Fuel Cell (SOFC) Program,  initiated in 2000 and led by the National Energy Technology Laboratory (NETL). NETL’s SOFC team, under the Hydrogen with Carbon Management Program, conducts R&D projects  on “technical issues facing the commercialization of R-SOFC technologies and pilot-scale testing… to validate the solutions.” This line of inquiry is designed to “enable the generation of efficient, low-cost electricity and hydrogen.” Areas of focus include cell degradation characterization and modeling, advanced electrode engineering, and systems engineering and analysis. (See sample publications on OSTI.gov.)

To learn more about innovations in SOFCs, SOECs, and R-SOFCs, consider checking out these upcoming events in 2026:

Mini-Mag: Issue 2

Issue no. 02 – Published  2018

Mini-Mag: Issue 1

Issue no. 01 – Published  2018

The INNOVATE Act: The Problems with Phase 1A

The Innovate act: The problems with Phase 1A


By Jenny C. Servo, Ph.D.

The Department of Defense has developed numerous ways to modify the Small Business Innovation Research (SBIR) and Small Business Technology Transfer (STTR) programs to rapidly secure solutions for the warfighter. From Commercial Solutions Offerings (CSO) to $50,000 Phase I awards that make a company instantly eligible for a government Phase III, DoD has demonstrated its ability to use both traditional and nontraditional methods to secure technologies that it needs for the warfighter more rapidly.

However, it appears that some small businesses that have benefited from the application of DoD’s tool kit, often become proponents of applying these same methods to all agencies. For example, the Phase 1A concept in the INNOVATE Act bears a striking resemblance to DoD’s Commercial Solutions Offering (CSO).  This is an optional approach used by DoD – not a mandated one – which enables companies with an existing commercial solution to make modifications to meet a DoD need.“CSO can be used to acquire innovative commercial items, technologies, or services that directly meet program requirements, whereas BAAs are restricted to basic and applied research.[1]

The proposed Phase 1A is intended to speed upon the entry of new applicants into the SBIR/STTR programs, by asking them to submit a two-page proposal in response to an “open topic” for which they could receive a $40,000 award. The proposed guidelines for the Phase 1A application includes: (1) Identification of the Problem, (2) Description of the Solution, (3) Impact of the Solution, (4) Differentiation and (5) Commercialization Strategy including both the commercial and government markets. The requirement for an “Open Topic” and the proposed outline suggests that very little is known about how civilian agencies differ from the Department of Defense. Here are a few of the differences:

    1. Most of the SBIR/STTR topics from civilian agencies ARE focused on basic and applied research.
    2. Many civilian agencies already have developed their own methods to quickly enable potential applicants to discern if there is a fit between their skills and the agencies needs. The National Science Foundation uses the Project Pitch, the Department of Energy uses the Letter of Intent, and the National Institute of Health uses Aims.
    3. Civilian agencies already conduct outreach to bring in hundreds of new applicants each year and provide support in proposal preparation through federally funded Phase 0 programs. The Department of Energy has provided the DOE Phase 0 support for more than 10 years, as has the National Institutes of Health through its Applicant Assistance Program. These programs are comprehensive and cost effective.
    4. Most civilian agencies have funded I-Corps and make this available in various forms in order to assure that small businesses speak with their potential customers.
    5. Although Government Phase IIIs are theoretically available to all agencies, granting organizations tend not to use this mechanism as their mission is focused on “public good”, as opposed to being focused on a government mission.

The bottom line is that there is no need to substitute effective solutions that agencies have already developed with an approach that will overwhelm their staff and require more taxpayer money. Existing federal Phase 0 programs cost between $5,000 and $7,000 per company, as opposed to $40,000 as proposed by the INNOVATE ACT.  It is important to note that the Department of Defense, which accounts for more than half of the available SBIR/STTR funding, has far more staff to manage and implement its programs than smaller agencies with less resources.

The INNOVATE ACT maintains that “Phase 1A funds will bring thousands of new small business concerns committed to commercialization of critical technologies into the SBIR program.” However, there are no data to substantiate this belief, even though the argument is being made that by placing a cap on the number of awards that frequent award winners receive, an increase in first time applicants winning SBIR/STTR awards will increase.  However, the Annual SBIR/STTR Reports to Congress, provided by the Small Business Administration do not include any data regarding how many first-time applicants submit SBIR/STTR proposals,  how many of these were non-responsive, merited award or received an award. Such data are necessary to substantiate this assumption.

It is therefore suggested that in bill S. 853 “Phase 1A be presented as an option, rather than a mandate and that all agencies be required to use not less than 2.5% of their SBIR budget for either Phase IA or other outreach initiatives aimed at bringing in qualified, first time SBIR/STTR applicants. Existing Federal Phase 0 programs are funded with “outreach” dollars which would be eliminated by a mandated Phase 1A requirement.

[1] DAU, Commercial Solutions Opening (DFARS 212.70), accessed August 20, 2025

Jenny C. Servo, Ph.D. is the President and Founder of Dawnbreaker, a woman-owned small business located in Rochester, NY which has provided commercialization assistance to SBIR/STTR awardees since 1990.

Email
Twitter
LinkedIn

Market Snapshot: Plastic Circularity

Written by: Jenny C. Servo,Ph.D. & Erin George, MLS

Who could have imagined that the search for a substitute for ivory used in billiard balls in the 19th century[1] would give rise to an industry whose impact today is already preserved in sedimentary layers of the earths’ fossil record[2]. Dubbed as the “plastics age”, research conducted by the Scripps Institution of Oceanography in the Santa Barbara basin off the California coast[3] has demonstrated that since the 1940’s microscopic sediments in the ocean have doubled about every 15 years. The more apparent, visible signs of the pervasive use of plastics today is seen in the “Great Pacific Garbage Patch” – regions of the Pacific ocean. as large as the state of Texas[4], filled with the stifling debris of plastic.

The impact on the environment which most consumers don’t see, could have a profound impact on the food chain. There is growing evidence that microplastics, pieces of plastic less than five millimeters in length, are entering the food chain. “Microplastic exposure to humans is caused by foods of both animal and plant origin, food additives, drinks[5], and plastic food packaging.”[6] There is also evidence that nanoplastics, smaller than 1 micrometer can enter human cells and cause DNA damage[7].

The “take-make-waste” model is no longer acceptable. Taking oil and gas from the earth, turning it into plastic and then throwing it away is having profound and negative impact.[8] Data on what happens to waste varies, but in general, 14% of plastic waste is collected for recycling, 14% is incinerated and/or used for energy recovery, 40% is landfilled and 32% leaks into the oceans.[9] The concept of the circular economy mirrors the sustaining processes in nature. “In a new plastics economy, plastic never becomes waste or pollution.[10]

Although the concept of a circular economy has gained traction, there are over one hundred definitions of what that means[11]. However, when it comes to plastics, the definition used by plasticmakers.org is clear “Circularity means using plastics… more efficiently by keeping the material in use for as long as possible, getting the most we can from the material during its use, and then recovering it to make new products.[12]

The market for plastic circularity is growing. According to the American Chemistry Council, it is important however to note that there are differences between durable and non-durable  plastics and the end-of-life  (EOL) methods each uses for recycling. Durable plastics that are meant to be in use for many years and are used in automotive, building and construction, electronics and medical industries. Non-durable plastics are those intended for single use and packaging. The global market for recycled plastics, according to MarketsandMarkets, was valued at $69.4 billion in 2023 and projected to reach $120 billion by 2030 at a growth rate of 8.1%.[13]

 The growing use of recycled plastics by major companies in the automotive, packaging, and electrical and electronics industries is a major driver of growth in the market, along with the policies and initiatives that are being implemented to promote the recycling of plastics and their reuse. Some of the key players in the U.S. market include MBA Polymers, Plastipak Holdings, Republic Services, and Stericycle.[14]

In a similar vein, MarketsandMarkets also reports on the global post-consumer recycled plastics market in 2024 was valued at $71.44 billion and projected to grow to $106.97 billion by 2029 at an 8.4% CAGR. The market is defined as those plastics that are recycled and collected from consumers such as bottles, films, and foams. Circular economy programs are promoting resource utilization and waste management which is a main driving factor in the growth of this market.[15]

[1] Arthur Neves, “First successful substitutes for ivory billiard balls were made with celluloid reinforced with ground cattle bone,” Phys.org, November 24, 2023

[2] Damian Carrington, “After bronze and iron, welcome to the plastics age, say scientists,” The Guardian, September 4, 2019

[3] Jennifer A. Brandon et al, “Multidecadal increase in plastic particles in coastal ocean sediments,” Science Advances, September 4, 2019

[4] National Geographic, “Great Pacific Garbage Patch” Accessed January 30, 2025

[5] Zia Sherrell, “Concerned about microplastics in tea bags? Here’s what researchers say you should know,” Yahoo/Life, January 30, 2025

[6] Abdullah al Momun et al, “Microplastics in human food chains: Food becoming a threat to human safety,” Elsevier, Volume 858, Part 1, February 2023

[7] Stephanie Duchen, “Microplastics everywhere,” Harvard Medicine, Spring 2023

[8] Ellen McArthur Foundation, “Plastics and the circular economy – deep dive,” September 15, 2019

[9] World Economic Forum, Ellen McArthur Foundation and McKinsey and Company, “The New Plastics Economy: Rethinking the future of plastics, “2016

[10] Ellen McArthur Foundation, “Plastics and the circular economy – deep dive,” September 15, 2019

[11] Julian Kircherr et al, “Conceptualizing the circular economy: An analysis of 114 definitions,” Resources, Conservation and Recycling,  Volume 127, December 2017

[12]  Plasticmakers.org, “ What is circularity?” Accessed January 31, 2025

[13]Recycled Plastics Market,” MarketsandMarkets, April 2023

[14]Recycled Plastics Market,” MarketsandMarkets, April 2023

[15]Post-Consumer Recycled Plastics Market,” MarketsandMarkets, October 2024

Market Snapshot: Precision Agriculture

Market Snapshot: Precision Agriculture

Agriculture, in its most general sense, is the science and art of cultivating plants and livestock, and is credited with shifting civilization from hunter gatherers to permanent settlements. Today, the agricultural landscape is increasingly complex as society looks for new, more efficient, and environmentally sound ways to address the water-food-energy nexus. The USDA reports that within agriculture, the greatest technology push has been in precision agriculture (also known as site-specific management or smart agriculture) where sensing, information technologies, and mechanical systems enable crop and livestock management.

Major factors contributing to the growth of the smart agriculture market include the increasing adoption of advanced technologies in various agriculture applications such as precision farming, smart green house, livestock monitoring, and fish farm monitoring. Changing weather patterns due to increasing global warming have impelled the adoption of advanced farming technologies to enhance farm productivity and crop yield. Farmers or growers across the globe are increasingly adopting advanced farming devices and equipment such as steering and guidance, sensors, yield monitors, display devices, and farm management software. MarketsandMarkets reports that the global precision farming market is forecast to grow from $9.7 billion in 2023 to $21.9 billion by 2031 growing at a CAGR of 10.7% from 2023 to 2031.

While there are many factors driving growth in this space, the high cost of technologies, and limited exposure among farmers who would utilize them is seen as restraining the market. Furthermore, smart agriculture requires high initial investment, efficient farming tools, and skilled and knowledgeable farmers or growers. The USDA notes that despite the push toward integrating smart or precision techniques, acceptance by the agricultural community has been hesitant and weak, although most producers admit they will have to adopt these technologies eventually. Specific and recent trends in this area are addressed in the 2023 paper from USDA titled, Precision Agriculture in the Digital Era: Recent Adoption on U.S. Farms.

Key players in the precision farming market include Deere & Company (John Deere) (U.S.), Trimble Inc. (U.S.), AGCO Corporation (U.S.), AgJunction LLC (U.S.), Raven Industries, Inc. (U.S.), AG Leader Technology (US), Teejet Technologies (U.S.), Topcon (U.S.), Taranis (Israel), AgEagle Aerial Systems Inc (U.S.), ec2ce (Spain), Descartes Labs, Inc. (U.S.), Granular Inc. (U.S.), Hexagon AB (Brazil), Climate LLC (U.S.), and CropX Inc. (Israel). The leading players in this market have leveraged merger & acquisition, partnership, collaboration, and product launch strategies to grow in the global precision farming market.

The International Conference for On-Farm Precision Experimentation will be taking place in 2024 along with several other events happening in 2023 and 2024.

Market Snapshot: Biomass & Biofuels

Biomass is unique in that it can be converted directly into liquid fuels, called biofuels to help meet transportation fuel needs. The two most common types of biofuels in use today are ethanol and biodiesel, these are also known as “drop-in” fuels, meaning they can serve as petroleum substitutes in existing refineries, tanks, pipelines, pumps, vehicles, and smaller engines.

While almost two-thirds of biofuel demand growth will occur in emerging economies, primarily India, Brazil and Indonesia biofuel demand is forecast to rise by 6% or 5,700 million liters between 2022 and 2024 in advanced economies with the majority of the increase happening in the United States and Europe. Biomass According to BCC Research, the global liquid biofuels market should reach $153.8 billion by 2024 from $136.2 billion in 2019 at a compound annual growth rate (CAGR) of 2.2% for the forecast period of 2019 to 2024. The following sections break this broader market down into the markets for ethanol and biodiesel.

Ethanol is an alcohol most commonly made by fermenting any biomass high in carbohydrates through a process similar to beer brewing, but it can also be produced by a process called gasification, which uses high temperatures and a low-oxygen environment to convert biomass into synthesis gas, a mixture of hydrogen and carbon monoxide. The resulting synthesis gas (syngas) can then be chemically converted into ethanol and other fuels. Typically, ethanol is used as a blending agent with gasoline to increase octane and cut down carbon monoxide and other smog-causing emissions. MarketsandMarkets reports that the global bioethanol market is projected to grow from $33.7 billion in 2020 to $64.8 billion by 2025, at a CAGR of 14.0%, from 2020 to 2025. Demand for bioethanol is driven by the mandatory use of bioethanol fuel blends in many countries to reduce greenhouse gas (GHG) emissions and increase the fuel efficiency of the vehicles.

In terms of the different fuel blends, the E10 segment is projected to be the largest market for bioethanol given that Europe countries and across other regions have mandated the use E10 fuel blends in vehicles to lower the GHGs emission rate. Additionally, a small percentage of bioethanol can be mixed with the pure gasoline to prepare bioethanol blends, which burn more efficiently and produce zero carbon emission.  As a result, the use of bioethanol fuel blends is mandated in many countries around the world. Based on these factors, transportation is projected to be the largest end-use segment of the bioethanol market in terms of value and volume.

Biodiesel, the other biofuel, is made by combining alcohol with vegetable oil, animal fat, or recycled cooking grease, and can be used as an additive to reduce vehicle emissions or in its pure form as a renewable alternative fuel for diesel engines. Although the pace of research interest had slowed, research into the production of liquid transportation fuels from microscopic algae, or microalgae, is on the upswing at NREL. MarketsandMarkets reports that the biorefinery market size is estimated to be $210.3 billion by 2027 up from $141.8 billion in 2022 growing at a CAGR of 8.2% during the forecast period.

Oil crops such as rapeseed, palm, or soybean are the largest source of biodiesel, which makes it a sustainable alternative compared to conventional diesel. Furthermore, biodiesel meets both the biomass-based diesel and overall advanced biofuel requirement of the Renewable Fuel Standard – it also meets specifications created by the American Society of Testing and Materials (ASTM) for legal diesel motor fuel (ASTM D975) and the definition for biodiesel itself (ASTM D6751). Pure biodiesel is referred as B100 (100% biodiesel) but is rarely used given that existing diesel engines may not be suitable for pure biodiesel. Therefore, just like with ethanol, blends are used that have a certain proportion of biodiesel mixed with fossil diesel. Most of the current diesel engines are capable of handling biodiesel blended fuels. – the most common blends currently in use are B5 (up to 5% biodiesel) and B20 (6% to 20% biodiesel).

In June 2023 the USDA announced plans to invest up to $500 million from the Inflation Reduction Act to increase the availability of domestic biofuels and give Americans additional cleaner fuel options at the pump. Also in June of 2023 the EPA announced a final rule to establish biofuel volume requirements and associated percentage standards for cellulosic biofuel, biomass-based diesel (BBD), advanced biofuel, and total renewable fuel for 2023–2025. DOE has also announced several sources of funding for biofuels in 2023.

Market Snapshot: Wildfire Protection

From air quality alerts to the loss of natural habitats and homes, the threat and impact of wildfires has become increasingly concerning in many parts of the United States. Approximately 85% of wildfires in the United States are caused by humans, whether it is from unattended campfires, arson, or equipment malfunctions – these events are costly and dangerous. Since 2000 an annual average of 70,025 wildfires have burned an annual average of 7.0 million acres, which is more than double the average annual acreage burned in the 1990s.

In 2022, 52% of the nationwide acreage burned by wildfires was on federal lands for which the federal government is responsible. The U.S. Department of Agriculture Forest Service (FS) carries out wildfire management and response across the National Forest System (NFS), and the Department of the Interior (DOI) manages wildfire response for national parks, wildlife refuges and preserves, other public lands, and reservations. As of June 1, 2023, approximately 18,300 wildfires have impacted over 511,000 acres within the U.S. this year. 

To address the wildfire crisis the Forest Service launched a comprehensive 10-year strategy in January 2022 focused on the communities most likely to be immediately impacted. The strategy, called “Confronting the Wildfire Crisis: A Strategy for Protecting Communities and Improving Resilience in America’s Forests,” combines congressional funding with scientific research and planning to create a national effort designed to increase the scale and pace of forest health treatments over the next decade. The Forest Service plans to work with states, Tribes and other partners to addresses wildfire risks to critical infrastructure, protect communities, and make forests more resilient through this strategy.

While wildfires are not the only fire-related threat, Grandview Research reports that the global fire protection system market size was valued at $77.88 billion in 2022 and is expected to grow at a compound annual growth rate (CAGR) of 6.6% from 2023 to 2030 – this market is not limited to wildfire, protection and includes myriad sources and systems. With a focus on wildfire prevention and management, the Institute for Defense & Government Advancement (IDGA) published a report covering spending and technology trends in this area. According to IDGA the wildfire prevention and management industry is pivoting from procurement to leasing of helicopters, aircraft and ground vehicles, to leasing with the Forest Service expected to spend $2.4 billion on leasing helicopters for wildfire purposes alone. Additionally, digital technologies such as artificial intelligence (AI), machine learning (ML), deep learning (DL) and robotics are playing a key role in the early detection of wildfires.

In March 2023 the U.S. Department of Agriculture’s Forest Service announced an investment of $197 million in 100 project proposals benefiting 22 states and seven tribes, as part of the Community Wildfire Defense Grant program, which is funded by the Bipartisan Infrastructure Law. Additionally, the Forest Service and other federal, tribal, state, and local partners  developed and are implementing a National Cohesive Wildland Fire Management Strategy that has three key components: Resilient Landscapes, Fire Adapted Communities, and Safe and Effective Wildfire Response. Other sources of potential funding for innovators includes the USDA Small Business Innovation Research (SBIR) and Small Business Technology Transfer (STTR) solicitations for qualified businesses.

To learn more about this area and more, several upcoming conferences and events may offer opportunities to interact with others working in this area, and discover more about the wildfire and wildland prevention space. The 2024 NFPA Conference & Expo® will be held in Orlando, Florida next June, and the International Association of Fire Chiefs is hosting several events in 2024.

Market Snapshot: Hypersonic Weapons

Operating in extreme environments presents many technical challenges. When these environments include the demands of hypersonic flight in the upper atmosphere, the challenges are even greater. The Congressional Research Service reports that the U.S. Department of Defense (DoD) is pursuing two types of hypersonic weapons technologies: boost-glide systems that place a maneuverable glide vehicle atop a ballistic missile or rocket booster, and cruise missiles that would use high-speed, air-breathing engines to travel to hypersonic speeds.

A leading difference between missiles armed with hypersonic glide vehicles (HGVs) and missiles armed with ballistic reentry vehicles is their ability to maneuver and change course after they are released from their rocket boosters. Furthermore, hypersonic vehicles operating in the upper atmosphere are subject to extreme speeds, these may exceed Mach 5, which is five times the speed of sound. These vehicles may also experience temperatures of over 1,000 degrees Celsius, oxidation from the atmosphere and tremendous aerodynamic shear loads. In addition to materials and coatings able to withstand these extreme environments, these platforms will necessitate flight control systems that are able to make rapid adjustments in response to the surrounding and rapidly changing flight conditions.

Despite these challenges, analysts report that the hypersonic missile market is expected to be valued at $130.50 million by 2028 at a compound annual growth rate (CAGR) of 2% during the forecast period (2023-2028). Deloitte notes that in the United States, annual unclassified defense spending requests for hypersonic technology have grown at a 26% CAGR since 2014 and already total more than $2.6 billion. This annual domestic spending is expected to grow to $5 billion by 2025 while the international hypersonic market was predicted to grow at a CAGR of 7.23% between 2018 and 2022. Furthermore, the hypersonic market has received more than $328 million in venture capital investment since 2015.

The development of hypersonic platforms and enabling technologies is being carried out by groups including prime contractors, government and universities, and small businesses. The leading prime contractors appear to be Lockheed Martin and Raytheon. Raytheon’s Hypersonic Air-breathing Weapon Concept (HACM) leverages Northrop Grumman scramjet propulsion system with the team reportedly on schedule to deliver a system to the Air Force, which has said it plans for the missile to be operational by fiscal year 2027. Lockheed Martin is partnering with the U.S. Navy to integrate hypersonic strike capability onto surface ships with the Conventional Prompt Strike (CPS) weapon system that will be integrated onto ZUMWALT-class guided missile destroyers (DDGs). The CPS is a hypersonic boost-glide weapon system that enables long range missile flight at speeds greater than Mach 5, with high survivability. Additionally, the Missile Defense Agency (MDA) is developing systems to counter hypersonic missiles with its Glide Phase Interceptor, which is a missile designed to shoot down a hypersonic weapon in the middle (or glide phase) of its flight.

In terms of research and development activities for enabling capabilities, researchers at the Johns Hopkins Applied Physics Laboratory (APL) are developing coatings that can stand up to the extreme environments of hypersonic flight in the upper atmosphere. The University of Texas at San Antonio is working on Pressure-Sensitive Paint Measurements of a Hypersonic Vehicle in support of NASA’s ULI Full Airframe System Technology (FAST), and the University of Virginia is also working on advanced hypersonic materials. To learn more about research and innovation in hypersonics there are several conferences happening in 2023 and 2024 –  the 5th Annual Hypersonic Weapons Summit takes place in September and 3rd National Summit on Hypersonic Weapons Systems is happening in April 2024.